The imminence of the Chinese New Year means a considerable increase in demand for gold. Around the festivities, it was reported that global metal consumption increased in 2023, led of course by China. However, the widespread push in Asia has not been enough to boost the price beyond the 2020 high. In the broader view, gold and silver fundamentals do not sustainably influence price movements. A single factor, unrelated to their intrinsic properties, is decisive to make them bright, or to darken them.
Opacity of precious metals
Many assumed that silver would be revalued and rise greatly due to the energy transition, since it is necessary to manufacture batteries, solar panels and other components. It was not so. Its price has not corresponded to the demand for industrial use. Nor has gold (which was expected to jump to a new clear historical record last year) validated expectations, nor has it served as a hedge against inflation, devaluation or rate increases. Yes, it has served to amass treasure or save to bequeath to those who are willing to assume losses in value.
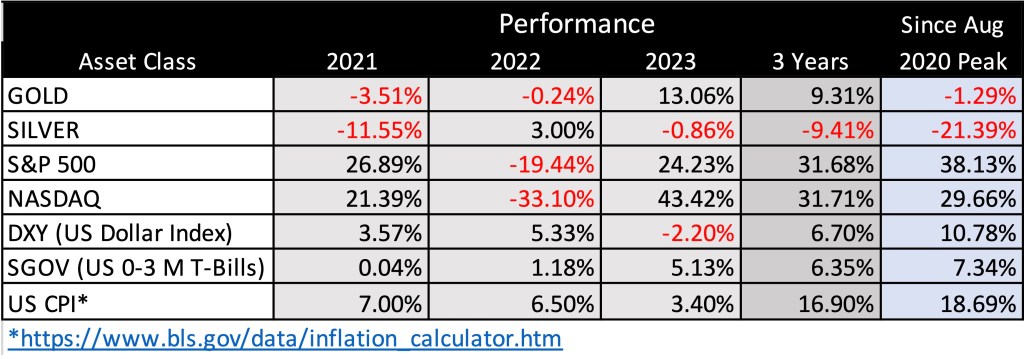
See the table to notice the disparity in returns in each year: 2023 was good for gold and barely negative for silver. In three years, gold rose 9.31%, almost the same amount that silver lost. Neither one nor the other counteracted the 16.9% accumulated inflation.
Also see that since reaching the all-time high in August 2020, and through the end of January, gold has lost 1.3%; silver, 21.4%. The accumulated inflation (according to the US Bureau of Labor Statistics) in that period was 18.7%. It would have been less harmful to allocate the money to T-Bills (emulated here by the SGOV ETF), or simply keep it in cash, in dollars, of course. Note the contrast against the returns of the S&P, Nasdaq, and even the US dollar index, DXY.
PROFITABILITY OF GOLD AND SILVER COMPARED TO OTHER REFERENCES
But the profits could have been large (or the losses, worse)
Now look at the graph. Between August 2020 and December 2023, there were four great opportunities (see the lower points) to buy gold (golden line) that returned up to 26% (figures in black); and four exit occasions (see peaks) that also led to drastic drops of up to 21% (figures in brown). At its three highest peaks, gold has returned to its all-time high, where it fluctuated at the end of the year and which it seemed to cling to in January.
Silver makes longer and more drastic swings (gray line in the secondary axis): It has bounced up to 34% (numbers in blue), while its precipitation was up to 32% (numbers in red). Its falls are exaggerated in negative streaks, while in good streaks it tends to rise more than gold. Although the rebounds are more profitable, silver is unable to return to the point from which each collapse begins. Since the height of each «crest» is lower than the previous one, the descent is schematic, in the form of a channel from the highest price in August 2020; Therefore, it is inferred that in the next upward reaction, if it occurs, it would not exceed $25;
GOLD, SILVER. PERFORMANCE AUGUST 2020 – JANUARY 2024
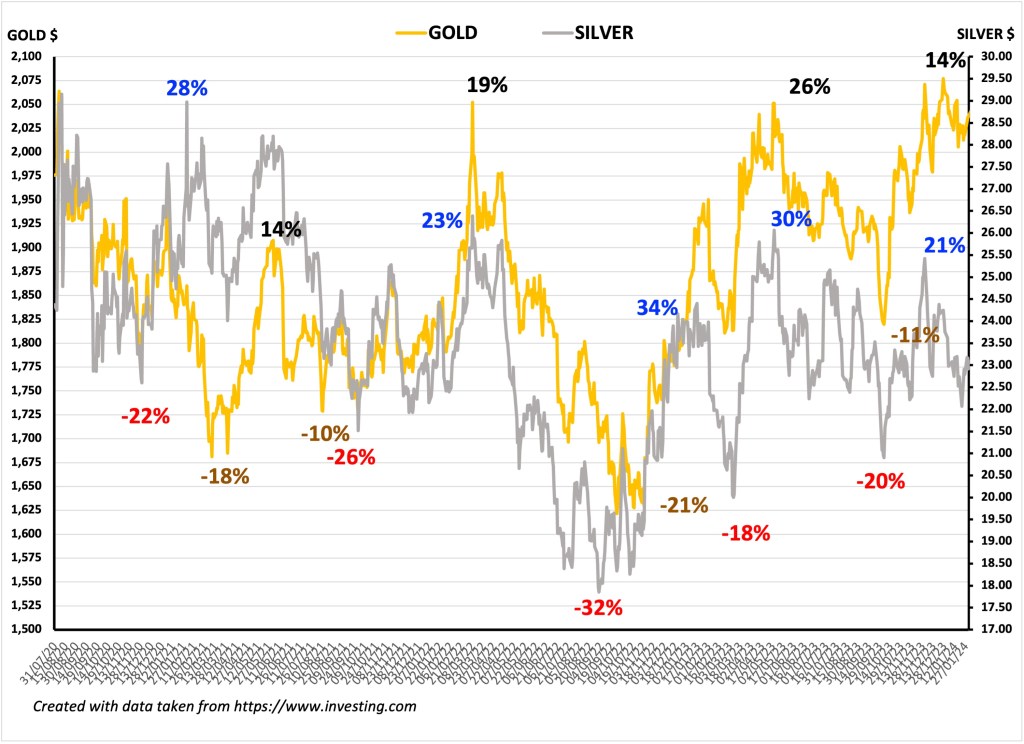
Consider a positive angle: from the lowest level of $17.85 in September 2022, silver’s lows are gradually higher. That is to say, in the next drop, if it occurs, it could stop around $22.00.
The problem is that its reaction from the bottom observed last October was less strong than that of gold. Towards the end of December, it weakened to lose the $24.00 level, while gold once again reached its all-time high. Note that, in January, when it relapsed, as always in the shape of a «V», the support of $22 was validated…
A single factor conditions gold and silver
For some, this behavior is extremely attractive: one could take advantage of buying around the lows and selling after the recovery, assuming, of course, high risk. Anyone who thinks that the behavior pattern is going to continue could take advantage of the ups and downs by taking short positions when they believe that prices are close to falling. They can use inverse ETFs (ZSL, GLL and others). Of course, this poses an even greater risk.
In the strict sense, for those who are risk averse, the performance of gold and silver is poor and debunks the myth that they serve as a protection of money. The periods of great increases have been due to the fact that interest rates have fallen to zero (0.00%), due to extraordinary factors, such as the great financial crisis of 2008-2009 and the pandemic of 2020-2021.
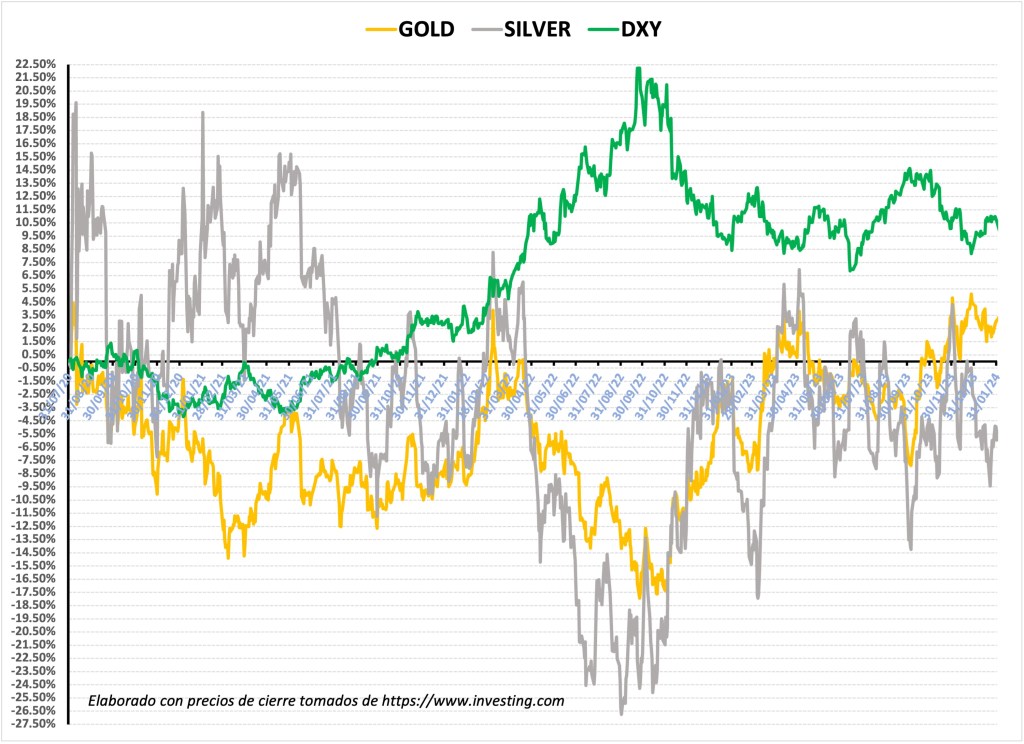
Since August 2020, the fluctuations of these metals have been in the opposite direction to those of the US dollar. Note in the third graph that the gold and silver peaks correspond to the dollar’s bottoms. Only in the first months of 2022, when the Russia – Ukraine war broke out, did metals and the dollar move in the same direction.
The most severe drop occurred between August and November 2022, when the Federal Reserve raised interest rates by 75 basis points in four consecutive meetings, to 4%. The collapse of silver and gold was up to 27% and 15%, respectively, while the dollar, shown as the only safe haven, rose more than 22% against the basket of six currencies of the DXY index. As metals fell to pre-pandemic levels, DXY surpassed 114 points, its highest peak in 20 years.
GOLD, SILVER, DXY. PERFORMANCE IN PERCENTAGE. AUGUST 2020 – JANUARY 2024
Is it feasible for prices to rise?
Forecasts have failed in the last three years. None of the metals validated expectations, based on consumption and industrial use, that there would be a price increase. The seesaw has depended on a single essential factor: the price of the USD. Demand, extraction or production have been secondary elements. And dollar, in turn, appreciates due to inflationary pressures and the consequent monetary restriction.
Will things change in 2024? It’s possible. If the Federal Reserve cuts rates and DXY falls below 100, gold and silver will shine again. So yes, consumption data in Asia or the global increase in industrial use will influence. That is, the potential does not seem to emanate from their intrinsic properties but from the moderation of inflation and monetary policy.

Deja un comentario